Final grades 2 11 codes only
•Download as XLSX, PDF•
0 likes•1 view
L
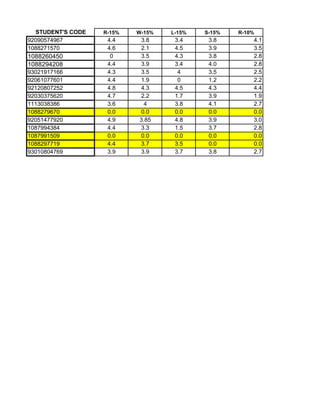
LuzThe document shows the grades of 15 students in 5 subjects (R, W, L, S, R) out of 100. It also shows the grades of the students in 3 other subjects (W, L, S) out of 10. The total grades of each student out of 500 is mentioned in the last column.
Report
Share
Report
Share

Recommended
Final grades 6 08 codes only
This document contains a table with student codes, grades for assignments weighted 15-10% across categories R, W, L, S, and a total grade percentage. There are 17 students listed with grades in 5 categories and a total grade calculated at the end.
Final grades 6 10 codes only
This document contains a table with student codes, grades in percentages for different subjects (R, W, L, S, R, W, L, S, R, and TOTAL), and total grades. There are 28 students listed with their grades in 15 subjects and an overall total grade calculated at the end.
Grafica de vivienda y esperanza de vida
The document contains a list of numerical values ranging from 0.1 to 31.3 with most values between 1 and 10. There are no labels or explanations for the values provided.
mansoane
The document provides specifications for aluminum cable clamps used for steel cable. It lists the material as aluminum and notes the standard as EN 13411-3 formerly DIN 3093 A. Dimensions, weights, and other technical details are provided for clamps of various diameters from 1mm to 60mm in a table.
ประกวด
The document outlines a multi-section structure, with the first section containing three subsections ranging from 1-3 or 4-6 items each. The second section has two subsections, one listing three items and another containing a single item. The third section includes several numbered subsections addressing different topics, with some containing ranges or specific numbers. The fourth section discusses allocating a total of 100 across five subsections in increments of 20. The fifth section provides a grading scale ranging from 60 to 100.
ประกวด
The document outlines a multi-section structure, with the first section containing three subsections assigning numeric ranges. The second section has two subsections, one referencing a number and the other containing a list. The third section includes several numbered subsections assigning values and referencing additional numbers. Performance is scaled into letter grades ranges in a later section.
Age Pyramids
This document contains demographic data on the population of Palo Alto, California in 2010 broken down by age group, sex, race, and other categories. It includes population counts and percentages for white and Asian residents in Palo Alto across different age groups. Charts are also included showing age pyramids for the total population as well as for white and Asian subgroups.
[대학내일20대연구소] 2017 20대 온라인정보 이용행태 및 인식조사 (연구리포트 2017-05)
This document contains tables of percentages and numerical values. The first table shows percentages ranging from 38.0% to 1%. The second table shows numerical values ranging from 64.2 to 11.8. The third table displays percentages with the highest being 25.3% and lowest being 0.2%.
Calendario Lunar ecuador 2017
This document is a lunar calendar for Ecuador in 2017. It shows the lunar phase percentages for each day of the month from January to December. The percentages range from 0% to 100% to indicate the illumination of the moon each night from new moon to full moon and back to new moon over the course of each month.
[대학내일20대연구소] 부모와의 관계 및 효에 관한 20대 인식조사 (연구리포트 2017-06)
The document contains tables of percentages across multiple categories. The first table shows percentages ranging from 14.0% to 84.8% across 5 categories. The second table shows percentages ranging from 2.0% to 88.2% across 8 categories. The third table shows percentages ranging from 2.6% to 58.9% across 5 categories.
Corega wireless camera instruction manual
The document is divided into 4 parts. Part 1 discusses topic A. Part 2 discusses topic B. Part 3 provides details on topic C over several paragraphs. Part 4 concludes by wrapping up topics D and E.
Cimarex Energy's Bruin-Walbridge 1-H Horizontal Rogersville Shale Flow Back ...
This document contains daily production data from a flow back operation between April 29, 2017 and February 18, 2017. It includes metrics like tubing pressure, casing pressure, back pressure, gas production in MCF/day, water production in bbl/day and oil production in bbl/day. Over the period a total of 54,169 barrels of water were injected and 169,571 barrels were recovered, for a recovery percentage of 56.2%.
Rogersville Shale Production Data Modified from Open Records Correlated to F...
First Successful Horizontal Completion in the Rogersville Shale.
The Cimarex Bruin Walbridge 1-H
The numbers are moderate with obviously dryer gas than what was rumored or anticipated.
Numbers show a lot of promise, particularly within the Rogersville Oil Window.
History's First three Marcellus horizontal wells, 1st-20 mcfp/d, 2nd-250 mcfp/d, 3rd-600 mcfp/d.
It took Range a hundred and fifty million dollars and 5 wells including the first vertical to get to over a million cfd out of any of the wells, this first horizontal Rogersville wildcat is as good as Range's first 4 Marcellus wells combined.
City hall final
The document appears to contain lighting design information for a site plan, including fixture locations, light levels, and fixture specifications. It lists the average, maximum, and minimum light levels calculated for zone #2 as 1.5 fc, 6.5 fc, and 0.3 fc respectively. It also provides notes on fixture heights around the site from 8-25 feet and wattages used, with 400W fixtures in the middle and 50W architectural lights around the parking lot.
Cimarex Energy's Walbridge 1-H First Successful Rogersville Shale Horizontal ...
First Successful Horizontal Completion in the Rogersville Shale.
Holds the Kentucky record for deepest well (MD) at 16,108'
Holds the Kentucky record for largest successful completion.
The numbers are moderate with obviously dryer gas than what was rumored or anticipated.
Numbers show a lot of promise, particularly within the slightly shallower "Rogersville Oil Window".
History's first three Marcellus horizontal wells, 1st-20 mcfp/d, 2nd-250 mcfp/d, 3rd-600 mcfp/d
Boya
This document contains monthly average wind speed and direction data from 1997 and 2015 for a location at 8°N 165°E. It includes two tables displaying the average zonal (U) and meridional (V) wind components in meters per second for each month, along with yearly average values. Two line graphs show the monthly trends in zonal and meridional wind speeds for the two years.
[대학내일20대연구소] 인턴십에 대한 3개국 인식 비교 (연구리포트 2018-3)
The document appears to contain survey results from multiple countries including Korea, US, and Japan. It includes percentages for different survey questions across different countries. Some of the key results include over 80% of respondents seeing online education as necessary or very necessary. Around 30-40% of respondents preferred online education platforms from their own country compared to global platforms. Over 50% of respondents across countries agreed that online education can be as effective as offline education.
Ergonomia
Facilità di accesso e orientamento in Bicocca: uno studio nella prospettiva di un miglioramento. Analisi svolta durante il corso di Ergonomia Cognitiva
เฉลยวิชาสุขศึกษา ศิลปะ การงานอาชีพฯ รหัสวิขา 06
The document contains a list of 150 numbers ranging from 1.1 to 150.4 in increments of 0.1, with some numbers containing multiple values separated by commas.
เฉลย50
The document contains a list of 150 numbers ranging from 1.1 to 150.4 in increments of 0.1, with some numbers containing multiple decimals.
เฉลย 50
The document contains a list of 150 numbers ranging from 1.1 to 150.4, with most numbers containing 1-4 decimal places. The numbers are not in any obvious order and include some duplicate and multi-value entries like 102,4 and 107.2,3,4.
เฉลยข้อสอบวิชาสุขศึกษา ศิลปะ การงานอาชีพ ปี50
The document contains a list of 150 numbers ranging from 1.1 to 150.4 in increments of 0.1, with some numbers containing multiple decimals.
[대학내일20대연구소] 2016 전국 대학생 온라인커뮤니티 이용실태조사 (연구리포트 2016-08)
This document contains various percentages and numerical values that are likely related to statistical data from a survey or study. The highest percentage listed is 86.3% while the lowest is 0.0%. Most numbers range from the high single digits to mid-60s percent. Various sections are labeled but without more context it is difficult to determine what exactly the data represents or pertains to.
[대학내일20대연구소] 2030세대 영어와 영어교육에 대한 인식 조사 report (연구리포트 2017-02)
This document appears to contain survey results from multiple choice questions with percentages listed for each answer choice. Some of the key findings include:
- 48.3% of respondents chose the first answer for question 1, and 34.7% chose the second answer.
- For question 3, the most popular answer was the third choice at 19.6% and the least was the sixth at 8.1%.
- The first answer was ranked first for questions 5 and 6, second for question 7, and third for question 8.
- For question 11, the most popular answer was the third choice at 24.7% and the least was the fifth at 9.8%.
[대학내일20대연구소] 2017 20대 소비&라이프스타일 트렌드 조사 (연구리포트 2017-09)
The document contains tables of percentages. The first table shows percentages ranging from 62.5% down to 16.5%. Subsequent tables show varying percentages, with some as high as 84.1% and some as low as 1.4%. Across the multiple tables are percentages related to different subjects that are not specified.
Fredy
This document contains a series of numbers with varying decimals. It does not provide any context or explanation for the meaning or purpose of the numbers. The high-level information that can be summarized is simply that the document contains numerical data without any accompanying description.
Talleres lectoescritura mayo 7
This document appears to be a table containing the grades and scores of 103 students on various grammar workshops and exercises. It lists the student ID numbers along with their scores on different components of the workshops including connectors, deixis, corrections, inferences, and more. The scores range from 0 to 5.
The use of waveform cross correlation for creation of an accurate catalogue o...
Page 3
In the current study of mining activity within the Russian platform, we use the advantages of location and historical bulletins/catalogues of mining explosions recorded by small-aperture seismic array Mikhnevo (MHVAR). The Institute of Geospheres Dynamics (IDG) of the Russian Academy of Sciences runs seismic array MHVAR (54.950N; 37.767E) since 2004.
Small-aperture seismic array “Mikhnevo” includes ten vertical stations (solid triangles), with one station in the geometrical centre of the array (C00) and other nine stations distributed over three circles with radii of 130 m, 320 m, and 600 m. The array aperture in approximately 1.1 km. Two 3C stations (solid triangles in circles) were added to the outer circle in order to improve the overall stations sensitivity (detection threshold) and resolution. All stations are equipped with short-period seismometers SM3-KV, which are characterized by flat response between 0.8 Hz and 30 Hz and gain of 180,000 [Vs/m]. Later, a 3C broad band station (BB) was installed in the centre of the array for surface wave measurements. The array response function (only for 12 vertical channels) is similar to that for many small-aperture arrays. Such arrays are designed to measure high-frequency signals from regional and near-regional sources with magnitudes above 1.5-2.0.
Page 4
MHVAR detects regional seismic phases (Pn, Sn, Lg, Rg) from various sources. Figure shows some selected waveforms with source-station distance decreasing up-down. Correspondingly the length of records decreases – for the closest mines it’s harder to distinguish between P and S phases.
Page 5
More than 50 areas at regional and near regional distances with different levels of mining activity have been identified by MHVAR. Since 2004, thousands of events have been reported in the IDG seismic catalogue as mining explosions. The IDG publishes this mining event catalogue as a part of the annual issues of “Earthquakes in Russia”, which is available for the broader geophysical community. The map shows several selected mines at near-regional distances where MHVAR successfully detects events with magnitudes 1.0 and lower. We also show a few selected mines at regional distances with the largest events of magnitude (ML) 2.0 and above. Such events should be also detected by IMS arrays. Joint interpretation of signals detected by MHVAR and IMS arrays allows significant improvements in signal detection, location, characterization and identification of events in the IDG catalogue when the historical data are revisited. The work on joint analysis of the IDG and IMS data is possible under the “Contract for limited access to IMS data and IDC products” between the CTBTO and IDG, which allows obtaining data through 2011.
To begin with, we have chosen blasts with larger magnitudes from well-known ironstone mine Mikhailovskiy (red circle), which is situated at regional distances somewhere between MHVAR (~330 km) and IMS array AKASG
St st pipe_pressure_rating_charts_rev_sep_2010
This document provides allowable working pressure tables for stainless steel grade 304 seamless pipes according to ASTM A 312. It lists the design strength and allowable working pressures in megapascals at different temperatures for various pipe sizes and schedules. Notes are provided regarding the calculation method, applicability to piping classes, and additional factors that must be considered for welded pipes. Conversion factors are also listed to convert pressures to other common units.
More Related Content
What's hot
Calendario Lunar ecuador 2017
This document is a lunar calendar for Ecuador in 2017. It shows the lunar phase percentages for each day of the month from January to December. The percentages range from 0% to 100% to indicate the illumination of the moon each night from new moon to full moon and back to new moon over the course of each month.
[대학내일20대연구소] 부모와의 관계 및 효에 관한 20대 인식조사 (연구리포트 2017-06)
The document contains tables of percentages across multiple categories. The first table shows percentages ranging from 14.0% to 84.8% across 5 categories. The second table shows percentages ranging from 2.0% to 88.2% across 8 categories. The third table shows percentages ranging from 2.6% to 58.9% across 5 categories.
Corega wireless camera instruction manual
The document is divided into 4 parts. Part 1 discusses topic A. Part 2 discusses topic B. Part 3 provides details on topic C over several paragraphs. Part 4 concludes by wrapping up topics D and E.
Cimarex Energy's Bruin-Walbridge 1-H Horizontal Rogersville Shale Flow Back ...
This document contains daily production data from a flow back operation between April 29, 2017 and February 18, 2017. It includes metrics like tubing pressure, casing pressure, back pressure, gas production in MCF/day, water production in bbl/day and oil production in bbl/day. Over the period a total of 54,169 barrels of water were injected and 169,571 barrels were recovered, for a recovery percentage of 56.2%.
Rogersville Shale Production Data Modified from Open Records Correlated to F...
First Successful Horizontal Completion in the Rogersville Shale.
The Cimarex Bruin Walbridge 1-H
The numbers are moderate with obviously dryer gas than what was rumored or anticipated.
Numbers show a lot of promise, particularly within the Rogersville Oil Window.
History's First three Marcellus horizontal wells, 1st-20 mcfp/d, 2nd-250 mcfp/d, 3rd-600 mcfp/d.
It took Range a hundred and fifty million dollars and 5 wells including the first vertical to get to over a million cfd out of any of the wells, this first horizontal Rogersville wildcat is as good as Range's first 4 Marcellus wells combined.
City hall final
The document appears to contain lighting design information for a site plan, including fixture locations, light levels, and fixture specifications. It lists the average, maximum, and minimum light levels calculated for zone #2 as 1.5 fc, 6.5 fc, and 0.3 fc respectively. It also provides notes on fixture heights around the site from 8-25 feet and wattages used, with 400W fixtures in the middle and 50W architectural lights around the parking lot.
Cimarex Energy's Walbridge 1-H First Successful Rogersville Shale Horizontal ...
First Successful Horizontal Completion in the Rogersville Shale.
Holds the Kentucky record for deepest well (MD) at 16,108'
Holds the Kentucky record for largest successful completion.
The numbers are moderate with obviously dryer gas than what was rumored or anticipated.
Numbers show a lot of promise, particularly within the slightly shallower "Rogersville Oil Window".
History's first three Marcellus horizontal wells, 1st-20 mcfp/d, 2nd-250 mcfp/d, 3rd-600 mcfp/d
Boya
This document contains monthly average wind speed and direction data from 1997 and 2015 for a location at 8°N 165°E. It includes two tables displaying the average zonal (U) and meridional (V) wind components in meters per second for each month, along with yearly average values. Two line graphs show the monthly trends in zonal and meridional wind speeds for the two years.
[대학내일20대연구소] 인턴십에 대한 3개국 인식 비교 (연구리포트 2018-3)
The document appears to contain survey results from multiple countries including Korea, US, and Japan. It includes percentages for different survey questions across different countries. Some of the key results include over 80% of respondents seeing online education as necessary or very necessary. Around 30-40% of respondents preferred online education platforms from their own country compared to global platforms. Over 50% of respondents across countries agreed that online education can be as effective as offline education.
Ergonomia
Facilità di accesso e orientamento in Bicocca: uno studio nella prospettiva di un miglioramento. Analisi svolta durante il corso di Ergonomia Cognitiva
เฉลยวิชาสุขศึกษา ศิลปะ การงานอาชีพฯ รหัสวิขา 06
The document contains a list of 150 numbers ranging from 1.1 to 150.4 in increments of 0.1, with some numbers containing multiple values separated by commas.
เฉลย50
The document contains a list of 150 numbers ranging from 1.1 to 150.4 in increments of 0.1, with some numbers containing multiple decimals.
เฉลย 50
The document contains a list of 150 numbers ranging from 1.1 to 150.4, with most numbers containing 1-4 decimal places. The numbers are not in any obvious order and include some duplicate and multi-value entries like 102,4 and 107.2,3,4.
เฉลยข้อสอบวิชาสุขศึกษา ศิลปะ การงานอาชีพ ปี50
The document contains a list of 150 numbers ranging from 1.1 to 150.4 in increments of 0.1, with some numbers containing multiple decimals.
[대학내일20대연구소] 2016 전국 대학생 온라인커뮤니티 이용실태조사 (연구리포트 2016-08)
This document contains various percentages and numerical values that are likely related to statistical data from a survey or study. The highest percentage listed is 86.3% while the lowest is 0.0%. Most numbers range from the high single digits to mid-60s percent. Various sections are labeled but without more context it is difficult to determine what exactly the data represents or pertains to.
[대학내일20대연구소] 2030세대 영어와 영어교육에 대한 인식 조사 report (연구리포트 2017-02)
This document appears to contain survey results from multiple choice questions with percentages listed for each answer choice. Some of the key findings include:
- 48.3% of respondents chose the first answer for question 1, and 34.7% chose the second answer.
- For question 3, the most popular answer was the third choice at 19.6% and the least was the sixth at 8.1%.
- The first answer was ranked first for questions 5 and 6, second for question 7, and third for question 8.
- For question 11, the most popular answer was the third choice at 24.7% and the least was the fifth at 9.8%.
[대학내일20대연구소] 2017 20대 소비&라이프스타일 트렌드 조사 (연구리포트 2017-09)
The document contains tables of percentages. The first table shows percentages ranging from 62.5% down to 16.5%. Subsequent tables show varying percentages, with some as high as 84.1% and some as low as 1.4%. Across the multiple tables are percentages related to different subjects that are not specified.
Fredy
This document contains a series of numbers with varying decimals. It does not provide any context or explanation for the meaning or purpose of the numbers. The high-level information that can be summarized is simply that the document contains numerical data without any accompanying description.
What's hot (19)
[대학내일20대연구소] 부모와의 관계 및 효에 관한 20대 인식조사 (연구리포트 2017-06)
[대학내일20대연구소] 부모와의 관계 및 효에 관한 20대 인식조사 (연구리포트 2017-06)
Cimarex Energy's Bruin-Walbridge 1-H Horizontal Rogersville Shale Flow Back ...
Cimarex Energy's Bruin-Walbridge 1-H Horizontal Rogersville Shale Flow Back ...
Rogersville Shale Production Data Modified from Open Records Correlated to F...
Rogersville Shale Production Data Modified from Open Records Correlated to F...
Cimarex Energy's Walbridge 1-H First Successful Rogersville Shale Horizontal ...
Cimarex Energy's Walbridge 1-H First Successful Rogersville Shale Horizontal ...
[대학내일20대연구소] 2016 전국 대학생 온라인커뮤니티 이용실태조사 (연구리포트 2016-08)
[대학내일20대연구소] 2016 전국 대학생 온라인커뮤니티 이용실태조사 (연구리포트 2016-08)
[대학내일20대연구소] 2030세대 영어와 영어교육에 대한 인식 조사 report (연구리포트 2017-02)
[대학내일20대연구소] 2030세대 영어와 영어교육에 대한 인식 조사 report (연구리포트 2017-02)
[대학내일20대연구소] 2017 20대 소비&라이프스타일 트렌드 조사 (연구리포트 2017-09)
[대학내일20대연구소] 2017 20대 소비&라이프스타일 트렌드 조사 (연구리포트 2017-09)
Similar to Final grades 2 11 codes only
Talleres lectoescritura mayo 7
This document appears to be a table containing the grades and scores of 103 students on various grammar workshops and exercises. It lists the student ID numbers along with their scores on different components of the workshops including connectors, deixis, corrections, inferences, and more. The scores range from 0 to 5.
The use of waveform cross correlation for creation of an accurate catalogue o...
Page 3
In the current study of mining activity within the Russian platform, we use the advantages of location and historical bulletins/catalogues of mining explosions recorded by small-aperture seismic array Mikhnevo (MHVAR). The Institute of Geospheres Dynamics (IDG) of the Russian Academy of Sciences runs seismic array MHVAR (54.950N; 37.767E) since 2004.
Small-aperture seismic array “Mikhnevo” includes ten vertical stations (solid triangles), with one station in the geometrical centre of the array (C00) and other nine stations distributed over three circles with radii of 130 m, 320 m, and 600 m. The array aperture in approximately 1.1 km. Two 3C stations (solid triangles in circles) were added to the outer circle in order to improve the overall stations sensitivity (detection threshold) and resolution. All stations are equipped with short-period seismometers SM3-KV, which are characterized by flat response between 0.8 Hz and 30 Hz and gain of 180,000 [Vs/m]. Later, a 3C broad band station (BB) was installed in the centre of the array for surface wave measurements. The array response function (only for 12 vertical channels) is similar to that for many small-aperture arrays. Such arrays are designed to measure high-frequency signals from regional and near-regional sources with magnitudes above 1.5-2.0.
Page 4
MHVAR detects regional seismic phases (Pn, Sn, Lg, Rg) from various sources. Figure shows some selected waveforms with source-station distance decreasing up-down. Correspondingly the length of records decreases – for the closest mines it’s harder to distinguish between P and S phases.
Page 5
More than 50 areas at regional and near regional distances with different levels of mining activity have been identified by MHVAR. Since 2004, thousands of events have been reported in the IDG seismic catalogue as mining explosions. The IDG publishes this mining event catalogue as a part of the annual issues of “Earthquakes in Russia”, which is available for the broader geophysical community. The map shows several selected mines at near-regional distances where MHVAR successfully detects events with magnitudes 1.0 and lower. We also show a few selected mines at regional distances with the largest events of magnitude (ML) 2.0 and above. Such events should be also detected by IMS arrays. Joint interpretation of signals detected by MHVAR and IMS arrays allows significant improvements in signal detection, location, characterization and identification of events in the IDG catalogue when the historical data are revisited. The work on joint analysis of the IDG and IMS data is possible under the “Contract for limited access to IMS data and IDC products” between the CTBTO and IDG, which allows obtaining data through 2011.
To begin with, we have chosen blasts with larger magnitudes from well-known ironstone mine Mikhailovskiy (red circle), which is situated at regional distances somewhere between MHVAR (~330 km) and IMS array AKASG
St st pipe_pressure_rating_charts_rev_sep_2010
This document provides allowable working pressure tables for stainless steel grade 304 seamless pipes according to ASTM A 312. It lists the design strength and allowable working pressures in megapascals at different temperatures for various pipe sizes and schedules. Notes are provided regarding the calculation method, applicability to piping classes, and additional factors that must be considered for welded pipes. Conversion factors are also listed to convert pressures to other common units.
Calificaciones 70% todas
La siguiente tabla muestra las calificaciones de los estudiantes matriculados en la unidad temática HIstoria de las Ciencias.
Universidad del Cauca.
Programa Lic. en Educación Básica.
Período: I de 2011.
Fecha de publicación: enero 30 de 2012
Segto uno1lectoescritura
The document appears to be a report listing grades for 103 students on various assignments for a course. It includes each student's ID number, grades for 7 grammar workshops on Dropbox, 2 essays on images with the first on Dropbox and second on Turnitin, and comments on forums about communication, readings, and writing on a blog. Grades range from 0 to 5.
Definitivas Jueves 12pm
This document appears to be a report containing data and grades for 14 students. It includes each student's name, ID number, and grades for 11 assignments (labeled L1 through L11). It then lists additional assignment grades and calculates a pre-infinitive grade, partial grade, and definitive grade for each student.
Planilladenotasjuancamilovanegas1
The document appears to be a report card or grading sheet for a class. It lists 34 students' names along with their monthly grades from February to November for an unspecified subject. The grades range from 3.3 to 4.8 on a scale of 5. Overall class performance was mixed, with some students maintaining grades above 4.0 throughout while others fluctuated more.
ES&FX.singlepweb email
This document provides information about Eastern Screw Co., a manufacturer and supplier of stainless steel fasteners. It summarizes their capabilities including manufacturing a wide range of fastener types in various materials, diameters and lengths. It also details their inventory, locations, services, and machining capabilities.
Comparativo estudios de_opinion
This document compares the results of several national public opinion polls in Mexico from August 2009 to June 2012. It shows the number of people surveyed, margin of error, and results on how people get their news, their economic outlook, ratings of President Felipe Calderón, and party sympathies. The polls generally found television to be the main source of news. Economic expectations were most often that the situation would be the same or worse than the previous year. Ratings of Calderón were average around 6 on a 0-10 scale. The PRI and PAN were usually the parties with the most sympathizers.
The Science and Practice of Cartographic Interaction
The document contains survey results from participants responding to questions in different categories. It includes a table with the sum and average scores for each question category (e.g. EMG, ENV, EPI) and total scores. Some categories like "How" received the highest total scores, while categories like "Who" and "Where" received lower total scores on average. The data provides an overview of participant responses to different types of questions in a survey.
Data logging heart rate
This document compares the heart rates of two people, Ong and Mei Ping, before and after exercise using a pulse sensor and data logger. The results show that Ong, who weighs less, has a lower heart rate at rest but a higher heart rate after exercise compared to Mei Ping. The experiment demonstrates how exercise causes an increase in heart rate and how those with lower body weights tend to have higher heart rates in response to physical activity.
Data logging- heart rate
This document compares the heart rates of two people, Ong and Mei Ping, before and after exercise using a pulse sensor and data logger. The results show that Ong, who weighs less, has a lower heart rate at rest but a higher heart rate after exercise compared to Mei Ping. The experiment demonstrates how exercise causes an increase in heart rate and how those with lower body weights tend to have higher heart rates in response to physical activity.
93 crit valuetables_4th
This document contains tables of critical values for various statistical tests including the z-distribution, t-distribution, chi-square distribution, and F-distribution. The z-distribution table lists critical values for the z-test across different levels of significance. Similarly, the other tables provide critical values for t-tests, chi-square tests, ANOVA, and other statistical analyses across different degrees of freedom and significance levels.
Planilla notas
The document appears to be a report card or grade sheet for multiple students in two subjects: Entrepreneurship and Spanish. It lists each student's name and their grades for each month or period. Some grades are missing for certain students and periods. Overall it tracks student performance in two classes over the course of a school year.
Planilla de notas
The document contains grades for students in a class across multiple months. It lists each student's name and their grades in February, March, and April in the first section. The second section lists the same students and their grades for the remaining months. There are a total of 32 students graded on a scale of 1 to 5 for each month.
Planilla de notas
The document contains grades for students in a class across multiple months. It lists each student's name and their grades in February, March, and April in the first section. The second section lists each student's grades for the remaining months. There are a total of 32 students graded on a scale of 1 to 5 for each month.
Withdrawl comparisons with age
Many people focus on just returns, thinking that the higher the return the better their results. While saving money the consequences of such a focus are not felt as much as they are once retired and trying to manage the pot of money to provide income for the rest of one's life.
Blog post on this graph will go live on 22 Jul 15 http://wp.me/p2Oizj-Dq
Dificulty Level
The document provides guidelines for scoring the difficulty of double dutch jumping routines for both individual masters and teams. It assigns point values from 0.0 to 10.0 based on the number and difficulty of skills performed, with higher scores indicating more advanced routines requiring a greater number of increasingly difficult skills.
Statistics.docx
The document provides summary statistics for 5 variables (v1-v5) measured in 200-201 observations. For each variable, it reports the number of valid and missing cases, measures of central tendency (mean, median, mode), dispersion (standard deviation, variance, range), and position (percentiles). Frequency tables display the count for each unique value in v1-v5. Stem-and-leaf plots further summarize the distribution of scores for each variable.
Similar to Final grades 2 11 codes only (20)
The use of waveform cross correlation for creation of an accurate catalogue o...
The use of waveform cross correlation for creation of an accurate catalogue o...
The Science and Practice of Cartographic Interaction
The Science and Practice of Cartographic Interaction
More from Luz
Present perfect
The document discusses the use of the present perfect tense in English. It is used to describe events that began in the past and continue in the present or events that happened at an unspecified time before now. Examples are provided to illustrate how the present perfect is used to talk about experiences, changes over time, accomplishments, uncompleted actions, and actions that occurred multiple times. Time expressions that can be used with the present perfect are also discussed.
Descriptive adj. and present perfect
Here are the sentences with the present perfect:
I have seen El Diario del Otun.
She has read the book.
It has been done.
We have already eaten.
Have you ever seen that movie?
Have they drunk the soda yet?
Have you read the book yet?
Has she gone to your house yet?
I haven't done my homework.
Final grades 2 11 codes only
The document shows the grades of 15 students in 5 subjects (R, W, L, S, R) out of 100. It also shows the grades of the students in 3 other subjects (W, L, S) out of 10. The total grades of each student out of 500 is mentioned in the last column.
Sentence Connectors
The document discusses various sentence connectors that can be used to link clauses and show different logical relationships between ideas. It provides examples of connectors that show addition, opposition, cause and effect, comparison, and contrast. It also includes a practice section with examples of correctly and incorrectly using connectors.
How To Write An Essay
This document provides instructions for writing an essay, including choosing a topic, outlining, drafting, revising, and finalizing the essay. It recommends that essays be 4-5 paragraphs long with 5-7 lines per paragraph. The topic should be something the writer enjoys and has researched. Brainstorming ideas related to the topic is suggested. The essay should include an introduction, body paragraphs with evidence and analysis, and a conclusion. Writers are advised to write continuously within paragraphs, read drafts aloud, and proofread the final draft before submission.
Sentence Connectors
The document discusses various sentence connectors that can be used to link clauses and show different logical relationships between ideas. It provides examples of connectors that show addition, opposition, cause and effect, comparison, and contrast. It also includes a practice section with prompts for using some of these connectors correctly.
Zero Conditional
The document discusses the zero conditional, which is used to describe situations where the result of a condition will always be the same, like scientific facts. It provides examples of zero conditional sentences using the present simple tense for both the if-clause and main clause. The key characteristic of the zero conditional is that the condition always leads to the same result. A chart is included to visualize the differences between zero, first, and second conditionals based on their probability and time frame.
More from Luz (9)
Recently uploaded
Meet Dinah Mattingly – Larry Bird’s Partner in Life and Love
Get an intimate look at Dinah Mattingly’s life alongside NBA icon Larry Bird. From their humble beginnings to their life today, discover the love and partnership that have defined their relationship.
Divertidamente SLIDE muito lindo e criativo, pptx
Slide criativo e muito lindo, apenas editar, muito simples
DIGIDEVTV A New area of OTT Distribution
At Digidev, we are working to be the leader in interactive streaming platforms of choice by smart device users worldwide.
Our goal is to become the ultimate distribution service of entertainment content. The Digidev application will offer the next generation television highway for users to discover and engage in a variety of content. While also providing a fresh and
innovative approach towards advertainment with vast revenue opportunities. Designed and developed by Joe Q. Bretz
原版制作(Mercer毕业证书)摩斯大学毕业证在读证明一模一样
学校原件一模一样【微信:741003700 】《(Mercer毕业证书)摩斯大学毕业证》【微信:741003700 】学位证,留信认证(真实可查,永久存档)原件一模一样纸张工艺/offer、雅思、外壳等材料/诚信可靠,可直接看成品样本,帮您解决无法毕业带来的各种难题!外壳,原版制作,诚信可靠,可直接看成品样本。行业标杆!精益求精,诚心合作,真诚制作!多年品质 ,按需精细制作,24小时接单,全套进口原装设备。十五年致力于帮助留学生解决难题,包您满意。
本公司拥有海外各大学样板无数,能完美还原。
1:1完美还原海外各大学毕业材料上的工艺:水印,阴影底纹,钢印LOGO烫金烫银,LOGO烫金烫银复合重叠。文字图案浮雕、激光镭射、紫外荧光、温感、复印防伪等防伪工艺。材料咨询办理、认证咨询办理请加学历顾问Q/微741003700
【主营项目】
一.毕业证【q微741003700】成绩单、使馆认证、教育部认证、雅思托福成绩单、学生卡等!
二.真实使馆公证(即留学回国人员证明,不成功不收费)
三.真实教育部学历学位认证(教育部存档!教育部留服网站永久可查)
四.办理各国各大学文凭(一对一专业服务,可全程监控跟踪进度)
如果您处于以下几种情况:
◇在校期间,因各种原因未能顺利毕业……拿不到官方毕业证【q/微741003700】
◇面对父母的压力,希望尽快拿到;
◇不清楚认证流程以及材料该如何准备;
◇回国时间很长,忘记办理;
◇回国马上就要找工作,办给用人单位看;
◇企事业单位必须要求办理的
◇需要报考公务员、购买免税车、落转户口
◇申请留学生创业基金
留信网认证的作用:
1:该专业认证可证明留学生真实身份
2:同时对留学生所学专业登记给予评定
3:国家专业人才认证中心颁发入库证书
4:这个认证书并且可以归档倒地方
5:凡事获得留信网入网的信息将会逐步更新到个人身份内,将在公安局网内查询个人身份证信息后,同步读取人才网入库信息
6:个人职称评审加20分
7:个人信誉贷款加10分
8:在国家人才网主办的国家网络招聘大会中纳入资料,供国家高端企业选择人才
Matt Rife Cancels Shows Due to Health Concerns, Reschedules Tour Dates.pdf
Matt Rife's comedy tour took an unexpected turn. He had to cancel his Bloomington show due to a last-minute medical emergency. Fans in Chicago will also have to wait a bit longer for their laughs, as his shows there are postponed. Rife apologized and assured fans he'd be back on stage soon.
https://www.theurbancrews.com/celeb/matt-rife-cancels-bloomington-show/
240529_Teleprotection Global Market Report 2024.pdf
The teleprotection market size has grown
exponentially in recent years. It will grow from
$21.92 billion in 2023 to $28.11 billion in 2024 at a
compound annual growth rate (CAGR) of 28.2%. The
teleprotection market size is expected to see
exponential growth in the next few years. It will grow
to $70.77 billion in 2028 at a compound annual
growth rate (CAGR) of 26.0%.
_7 OTT App Builders to Support the Development of Your Video Applications_.pdf
Due to their ability to produce engaging content more quickly, over-the-top (OTT) app builders have made the process of creating video applications more accessible. The invitation to explore these platforms emphasizes how over-the-top (OTT) applications hold the potential to transform digital entertainment.
Barbie Movie Review - The Astras.pdfffff
Barbie Movie Review has gotten brilliant surveys for its fun and creative story. Coordinated by Greta Gerwig, it stars Margot Robbie as Barbie and Ryan Gosling as Insight. Critics adore its perky humor, dynamic visuals, and intelligent take on the notorious doll's world. It's lauded for being engaging for both kids and grown-ups. The Astras profoundly prescribes observing the Barbie Review for a delightful and colorful cinematic involvement.https://theastras.com/hca-member-gradebooks/hca-gradebook-barbie/
Christian Louboutin: Innovating with Red Soles
Christian Louboutin is celebrated for his innovative approach to footwear design, marked by his trademark red soles. This in-depth look at his life and career explores the origins of his creativity, the milestones in his journey, and the impact of his work on the fashion industry. Learn how Louboutin's bold vision and dedication to excellence have made his brand synonymous with luxury and style.
定制(uow毕业证书)卧龙岗大学毕业证文凭学位证书原版一模一样
原版一模一样【微信:741003700 】【(uow毕业证书)卧龙岗大学毕业证文凭学位证书】【微信:741003700 】学位证,留信认证(真实可查,永久存档)offer、雅思、外壳等材料/诚信可靠,可直接看成品样本,帮您解决无法毕业带来的各种难题!外壳,原版制作,诚信可靠,可直接看成品样本。行业标杆!精益求精,诚心合作,真诚制作!多年品质 ,按需精细制作,24小时接单,全套进口原装设备。十五年致力于帮助留学生解决难题,包您满意。
本公司拥有海外各大学样板无数,能完美还原海外各大学 Bachelor Diploma degree, Master Degree Diploma
1:1完美还原海外各大学毕业材料上的工艺:水印,阴影底纹,钢印LOGO烫金烫银,LOGO烫金烫银复合重叠。文字图案浮雕、激光镭射、紫外荧光、温感、复印防伪等防伪工艺。材料咨询办理、认证咨询办理请加学历顾问Q/微741003700
留信网认证的作用:
1:该专业认证可证明留学生真实身份
2:同时对留学生所学专业登记给予评定
3:国家专业人才认证中心颁发入库证书
4:这个认证书并且可以归档倒地方
5:凡事获得留信网入网的信息将会逐步更新到个人身份内,将在公安局网内查询个人身份证信息后,同步读取人才网入库信息
6:个人职称评审加20分
7:个人信誉贷款加10分
8:在国家人才网主办的国家网络招聘大会中纳入资料,供国家高端企业选择人才
哪里买(osu毕业证书)美国俄勒冈州立大学毕业证双学位证书原版一模一样
原版纸张【微信:741003700 】【(osu毕业证书)美国俄勒冈州立大学毕业证,双学位证书】【微信:741003700 】学位证,留信认证(真实可查,永久存档)offer、雅思、外壳等材料/诚信可靠,可直接看成品样本,帮您解决无法毕业带来的各种难题!外壳,原版制作,诚信可靠,可直接看成品样本。行业标杆!精益求精,诚心合作,真诚制作!多年品质 ,按需精细制作,24小时接单,全套进口原装设备。十五年致力于帮助留学生解决难题,包您满意。
本公司拥有海外各大学样板无数,能完美还原海外各大学 Bachelor Diploma degree, Master Degree Diploma
1:1完美还原海外各大学毕业材料上的工艺:水印,阴影底纹,钢印LOGO烫金烫银,LOGO烫金烫银复合重叠。文字图案浮雕、激光镭射、紫外荧光、温感、复印防伪等防伪工艺。材料咨询办理、认证咨询办理请加学历顾问Q/微741003700
留信网认证的作用:
1:该专业认证可证明留学生真实身份
2:同时对留学生所学专业登记给予评定
3:国家专业人才认证中心颁发入库证书
4:这个认证书并且可以归档倒地方
5:凡事获得留信网入网的信息将会逐步更新到个人身份内,将在公安局网内查询个人身份证信息后,同步读取人才网入库信息
6:个人职称评审加20分
7:个人信誉贷款加10分
8:在国家人才网主办的国家网络招聘大会中纳入资料,供国家高端企业选择人才
From Swing Music to Big Band Fame_ 5 Iconic Artists.pptx
Know about the five famous artists who have transitioned to Big Band Music from Swing Music. Here is a glimpse of their work and contributions.
Unveiling Paul Haggis Shaping Cinema Through Diversity. .pdf
Paul Haggis is undoubtedly a visionary filmmaker whose work has not only shaped cinema but has also pushed boundaries when it comes to diversity and representation within the industry. From his thought-provoking scripts to his engaging directorial style, Haggis has become a prominent figure in the world of film.
The Unbelievable Tale of Dwayne Johnson Kidnapping: A Riveting Saga
Introduction
The notion of Dwayne Johnson kidnapping seems straight out of a Hollywood thriller. Dwayne "The Rock" Johnson, known for his larger-than-life persona, immense popularity. and action-packed filmography, is the last person anyone would envision being a victim of kidnapping. Yet, the bizarre and riveting tale of such an incident, filled with twists and turns. has captured the imagination of many. In this article, we delve into the intricate details of this astonishing event. exploring every aspect, from the dramatic rescue operation to the aftermath and the lessons learned.
Follow us on: Pinterest
The Origins of the Dwayne Johnson Kidnapping Saga
Dwayne Johnson: A Brief Background
Before discussing the specifics of the kidnapping. it is crucial to understand who Dwayne Johnson is and why his kidnapping would be so significant. Born May 2, 1972, Dwayne Douglas Johnson is an American actor, producer, businessman. and former professional wrestler. Known by his ring name, "The Rock," he gained fame in the World Wrestling Federation (WWF, now WWE) before transitioning to a successful career in Hollywood.
Johnson's filmography includes blockbuster hits such as "The Fast and the Furious" series, "Jumanji," "Moana," and "San Andreas." His charismatic personality, impressive physique. and action-star status have made him a beloved figure worldwide. Thus, the news of his kidnapping would send shockwaves across the globe.
Setting the Scene: The Day of the Kidnapping
The incident of Dwayne Johnson's kidnapping began on an ordinary day. Johnson was filming his latest high-octane action film set to break box office records. The location was a remote yet scenic area. chosen for its rugged terrain and breathtaking vistas. perfect for the film's climactic scenes.
But, beneath the veneer of normalcy, a sinister plot was unfolding. Unbeknownst to Johnson and his team, a group of criminals had planned his abduction. hoping to leverage his celebrity status for a hefty ransom. The stage was set for an event that would soon dominate worldwide headlines and social media feeds.
The Abduction: Unfolding the Dwayne Johnson Kidnapping
The Moment of Capture
On the day of the kidnapping, everything seemed to be proceeding as usual on set. Johnson and his co-stars and crew were engrossed in shooting a particularly demanding scene. As the day wore on, the production team took a short break. providing the kidnappers with the perfect opportunity to strike.
The abduction was executed with military precision. A group of masked men, armed and organized, infiltrated the set. They created chaos, taking advantage of the confusion to isolate Johnson. Johnson was outnumbered and caught off guard despite his formidable strength and fighting skills. The kidnappers overpowered him, bundled him into a waiting vehicle. and sped away, leaving everyone on set in a state of shock and disbelief.
The Immediate Aftermath
The immediate aftermath of the Dwayne Johnson kidnappin
Authenticity in Motion Pictures: How Steve Greisen Retains Real Stories
Learn about Steve Greisen's dedication to capture the spirit of his subjects in his documentaries with honesty and integrity.
Orpah Winfrey Dwayne Johnson: Titans of Influence and Inspiration
Introduction
In the realm of entertainment, few names resonate as Orpah Winfrey Dwayne Johnson. Both figures have carved unique paths in the industry. achieving unparalleled success and becoming iconic symbols of perseverance, resilience, and inspiration. This article delves into the lives, careers. and enduring legacies of Orpah Winfrey Dwayne Johnson. exploring how their journeys intersect and what we can learn from their remarkable stories.
Follow us on: Pinterest
Early Life and Backgrounds
Orpah Winfrey: From Humble Beginnings to Media Mogul
Orpah Winfrey, often known as Oprah due to a misspelling on her birth certificate. was born on January 29, 1954, in Kosciusko, Mississippi. Raised in poverty by her grandmother, Winfrey's early life was marked by hardship and adversity. Despite these challenges. she demonstrated a keen intellect and an early talent for public speaking.
Winfrey's journey to success began with a scholarship to Tennessee State University. where she studied communication. Her first job in media was as a co-anchor for the local evening news in Nashville. This role paved the way for her eventual transition to talk show hosting. where she found her true calling.
Dwayne Johnson: From Wrestling Royalty to Hollywood Superstar
Dwayne Johnson, also known by his ring name "The Rock," was born on May 2, 1972, in Hayward, California. He comes from a family of professional wrestlers, with both his father, Rocky Johnson. and his grandfather, Peter Maivia, being notable figures in the wrestling world. Johnson's early life was spent moving between New Zealand and the United States. experiencing a variety of cultural influences.
Before entering the world of professional wrestling. Johnson had aspirations of becoming a professional football player. He played college football at the University of Miami. where he was part of a national championship team. But, injuries curtailed his football career, leading him to follow in his family's footsteps and enter the wrestling ring.
Career Milestones
Orpah Winfrey: The Queen of All Media
Winfrey's career breakthrough came in 1986 when she launched "The Oprah Winfrey Show." The show became a cultural phenomenon. drawing millions of viewers daily and earning many awards. Winfrey's empathetic and candid interviewing style resonated with audiences. helping her tackle diverse and often challenging topics.
Beyond her talk show, Winfrey expanded her empire to include the creation of Harpo Productions. a multimedia production company. She also launched "O, The Oprah Magazine" and OWN: Oprah Winfrey Network, further solidifying her status as a media mogul.
Dwayne Johnson: From The Ring to The Big Screen
Dwayne Johnson's wrestling career took off in the late 1990s. when he became one of the most charismatic and popular figures in WWE. His larger-than-life persona and catchphrases endeared him to fans. making him a household name. But, Johnson had ambitions beyond the wrestling ring.
In the early 20
Everything You Need to Know About IPTV Ireland.pdf
The way we consume television has evolved dramatically over the past decade. Internet Protocol Television (IPTV) has emerged as a popular alternative to traditional cable and satellite TV, offering a wide range of channels and on-demand content via the internet. In Ireland, IPTV is rapidly gaining traction, with Xtreame HDTV being one of the prominent providers in the market. This comprehensive guide will delve into everything you need to know about IPTV Ireland, focusing on Xtreame HDTV, its features, benefits, and how it is revolutionizing TV viewing for Irish audiences.
The Evolution of the Leonardo DiCaprio Haircut: A Journey Through Style and C...
Leonardo DiCaprio, a name synonymous with Hollywood stardom and acting excellence. has captivated audiences for decades with his talent and charisma. But, the Leonardo DiCaprio haircut is one aspect of his public persona that has garnered attention. From his early days as a teenage heartthrob to his current status as a seasoned actor and environmental activist. DiCaprio's hairstyles have evolved. reflecting both his personal growth and the changing trends in fashion. This article delves into the many phases of the Leonardo DiCaprio haircut. exploring its significance and impact on pop culture.
Recently uploaded (20)
Meet Dinah Mattingly – Larry Bird’s Partner in Life and Love
Meet Dinah Mattingly – Larry Bird’s Partner in Life and Love
Matt Rife Cancels Shows Due to Health Concerns, Reschedules Tour Dates.pdf
Matt Rife Cancels Shows Due to Health Concerns, Reschedules Tour Dates.pdf
240529_Teleprotection Global Market Report 2024.pdf
240529_Teleprotection Global Market Report 2024.pdf
_7 OTT App Builders to Support the Development of Your Video Applications_.pdf
_7 OTT App Builders to Support the Development of Your Video Applications_.pdf
I Know Dino Trivia: Part 3. Test your dino knowledge
I Know Dino Trivia: Part 3. Test your dino knowledge
From Swing Music to Big Band Fame_ 5 Iconic Artists.pptx
From Swing Music to Big Band Fame_ 5 Iconic Artists.pptx
Unveiling Paul Haggis Shaping Cinema Through Diversity. .pdf
Unveiling Paul Haggis Shaping Cinema Through Diversity. .pdf
The Unbelievable Tale of Dwayne Johnson Kidnapping: A Riveting Saga
The Unbelievable Tale of Dwayne Johnson Kidnapping: A Riveting Saga
Authenticity in Motion Pictures: How Steve Greisen Retains Real Stories
Authenticity in Motion Pictures: How Steve Greisen Retains Real Stories
Orpah Winfrey Dwayne Johnson: Titans of Influence and Inspiration
Orpah Winfrey Dwayne Johnson: Titans of Influence and Inspiration
Everything You Need to Know About IPTV Ireland.pdf
Everything You Need to Know About IPTV Ireland.pdf
The Evolution of the Leonardo DiCaprio Haircut: A Journey Through Style and C...
The Evolution of the Leonardo DiCaprio Haircut: A Journey Through Style and C...
Final grades 2 11 codes only
- 1. STUDENT'S CODE R-15% W-15% L-15% S-15% R-10% 92090574967 4.4 3.8 3.4 3.8 4.1 1088271570 4.6 2.1 4.5 3.9 3.5 1088260450 0 3.5 4.3 3.8 2.8 1088294208 4.4 3.9 3.4 4.0 2.8 93021917166 4.3 3.5 4 3.5 2.5 92061077601 4.4 1.9 0 1.2 2.2 92120807252 4.8 4.3 4.5 4.3 4.4 92030375620 4.7 2.2 1.7 3.9 1.9 1113038386 3.6 4 3.8 4.1 2.7 1088279670 0.0 0.0 0.0 0.0 0.0 92051477920 4.9 3.85 4.8 3.9 3.0 1087994384 4.4 3.3 1.5 3.7 2.8 1087991509 0.0 0.0 0.0 0.0 0.0 1088297719 4.4 3.7 3.5 0.0 0.0 93010804769 3.9 3.9 3.7 3.8 2.7
- 2. W-10% L-10% S-10% TOTAL 3.6 2.9 3.8 3.7 4.8 3.8 3.8 3.8 4.0 2.9 4.0 3.1 2.6 2.1 4.2 3.5 2.9 3.7 2.5 3.5 4.0 2.9 3.0 2.3 3.9 3.3 4.3 4.3 3.3 2.1 3.9 3.0 3.4 3.7 4.2 3.7 0.0 0.0 0.0 0.0 3.9 3.7 4.2 4.1 1.7 2.5 3.7 3.0 0.0 0.0 0.0 0.0 0.0 0.0 0.0 1.7 3.4 2.1 3.7 3.5